If you’ve finished developing your business intelligence strategy and finally reached the point of having to decide which BI tool best is best for your business, you probably know that there’s still lots to do!
In its annual survey, the Business Application Research Center (BARC) rates 42 BI tools or packages. With so many products, and so many overlapping features and competing claims, how do you decide?
Using an independent BI consultancy, such as Stellar, means you’ll get unbiased recommendations, backed up with the skills and experience to implement the solution. Stellar is an authorised partner with many of the leading software providers.
The BARC survey can also help you distinguish among those 42 offerings, and allows you to narrow the field by viewing only those products within a “Peer Group” such as “Self-Service Reporting=Focused Products” and “Dashboarding-Focused Products”.
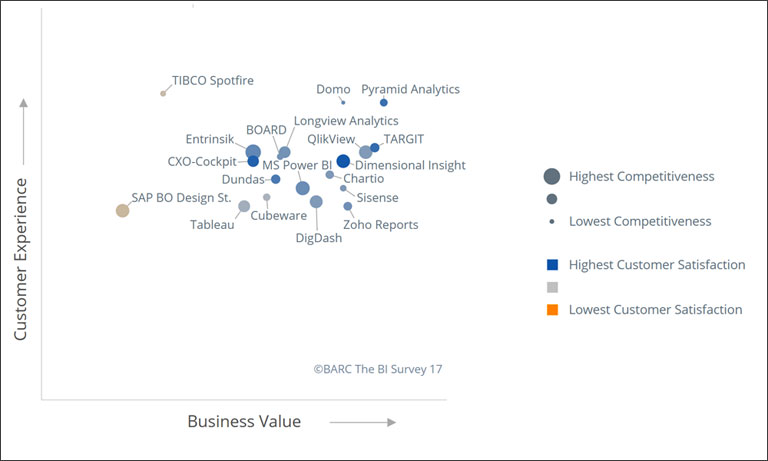
Within each peer group, the products are rated on business value (x-axis), customer experience (y-axis), customer satisfaction (color) and competitiveness (circle size), as in this example:

The survey is based on 2564 responses to a questionnaire. To be included in the final report, a BI tool needed at least 30 user reviews.
Not all BI tools are alike, say the report’s authors. Some are strong on reporting, while others are more suitable for dashboards or analytics.
Results from The BI Survey show the types of capabilities respondents use with their BI tools. Standard and enterprise reporting is top of the list followed by ad hoc query. The least popular BI capability this year is advanced analysis (e.g. predictive analytics or data mining), although it has the highest ‘planned’ rates, with 48 percent of respondents intending to start using advanced analytics in the future.
In addition to the survey report, BARC offers an online BI comparison tool.
You’ll probably still have lots of questions however. So give us a call and find out how Stellar can help you get on top of your data.


