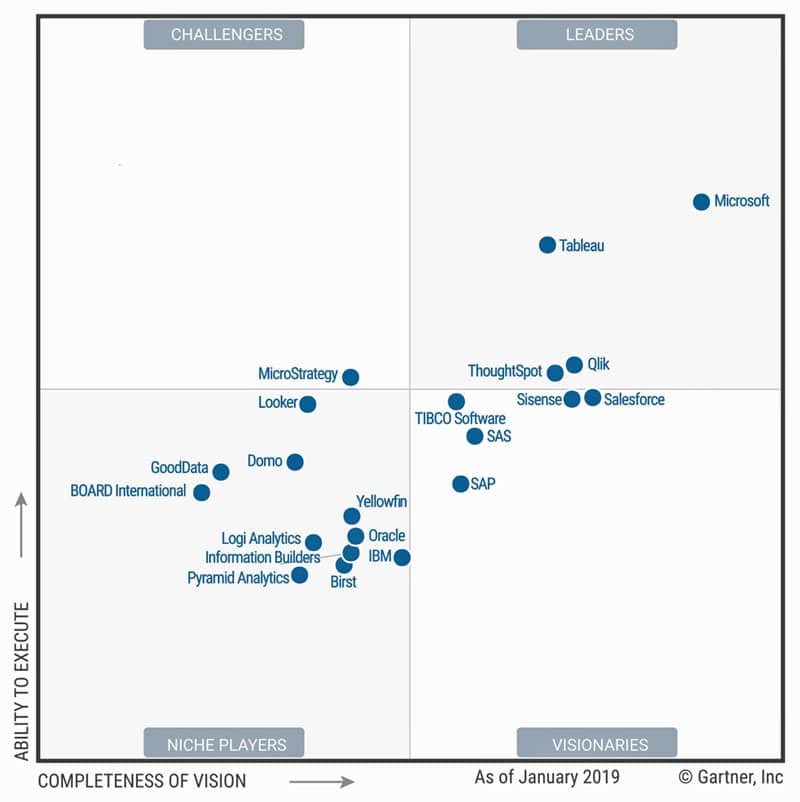
Gartner’s 2019 Magic Quadrant for Analytics and Business Intelligence Platforms has a familiar look about it, particularly in that all-important top right corner.
Once again, the vendors rated highest on Ability to Execute and Completeness of Vision are led by Microsoft, followed by Tableau and Qlik. ThoughtSpot joins them in the Leaders quadrant this year.

“Even though the Gartner Magic Quadrant is just one data-point, I believe it’s fairly reflective of what is a maturing market,” says Craig Larmer, Consulting Director at Stellar. “There is some movement between the quadrants but nothing significant. Tableau, Power BI and Qlik are rightfully dominating mind-share and implementations.
“This is just one slice of the BI market though, and I think the challenge for a lot of enterprises is how to integrate these modern tools over an increasingly complex data landscape to complement existing analytics systems.”
The Magic Quadrant covers products that meet Gartner’s criteria for a “modern analytics and BI platform.”
Modern analytics and business intelligence (BI) platforms are characterized by easy-to-use tools that support the full analytic workflow — from data preparation and ingestion to visual exploration and insight generation. They are most differentiated from traditional BI platforms by not requiring significant involvement from IT staff to predefine data models or store data in traditional data warehouses…
Microsoft’s Power BI was rated highly by Gartner for data preparation, visual-based data discovery, interactive dashboards and augmented analytics.
Power BI is available as a SaaS option running in the Azure cloud or as an on-premises option in Power BI Report Server. Power BI Desktop can be used as a stand-alone, free personal analysis tool. It is also required when power users are authoring complex data mashups involving on-premises data sources.
Although Power BI started out being used primarily as a self-service analytics and BI tool, Microsoft’s reference customers now use it mainly for decentralized analytics (61%) and agile, centralized BI provisioning (54%).
Microsoft is a Leader. It has a comprehensive and visionary product roadmap aimed at globalizing and democratizing Power BI for all analytics use cases. At the same time, it continues to demonstrate strong uptake and global adoption of Power BI, with high levels of customer satisfaction.
Gartner also noted that Microsoft is integrating a broad set of capabilities into Power BI, including enhancements to augmented analytics and making new AutoML features available in Azure Machine Learning.
Azure cognitive services, such as text, sentiment and image analytics and AI, will also be available through Power BI for use by people with minimal data science skills, among many others. Important roadmap items include full support for existing Reporting Services reports, a common and open data model, and open data preparation with data flows.
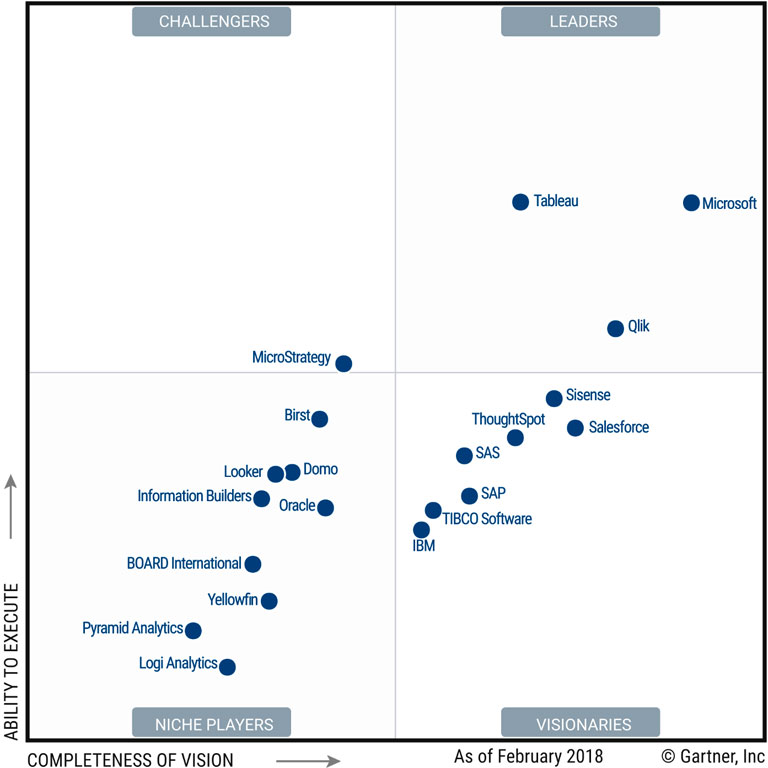
If you’d like to see how things have changed in the past year, here’s Gartner’s Magic Quadrant for 2018:

The Magic Quadrant refers to composite measures of success based on a survey of vendors’ reference customers. Opinions from Gartner Peer Insights contributors are also factored into the assessments. For more information, see gartner.com.


